前言:
大家一般都知道subplot可以畫子圖,但是subplots也可以畫子圖,鑒于subplots介紹比較少,這里做一個(gè)對(duì)比,兩者沒有功能一致。
對(duì)比開始:
需求:畫出兩張子圖,在一行顯示,子圖中的內(nèi)容一模一樣
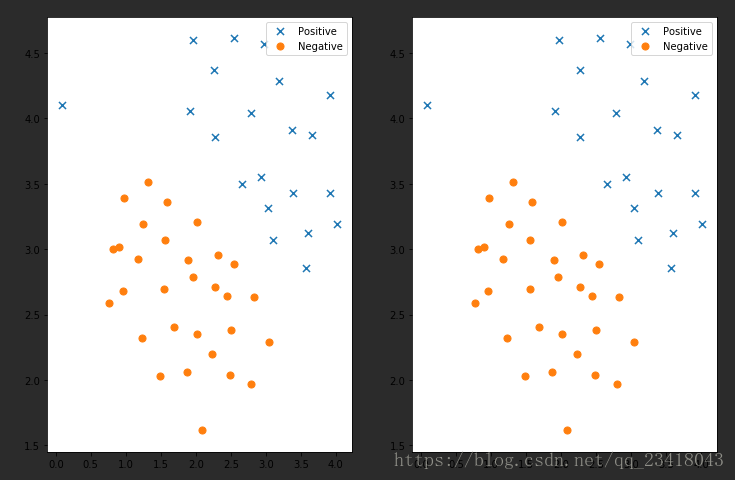
subplot代碼:
ax1 = plt.subplot(1,2,1)
ax1.scatter(positive['X1'], positive['X2'], s=50, marker='x', label='Positive')
ax1.scatter(negative['X1'], negative['X2'], s=50, marker='o', label='Negative')
ax1.legend()#添加圖列就是右上角的點(diǎn)說明
ax2 = plt.subplot(1,2,2)
ax2.scatter(positive['X1'], positive['X2'], s=50, marker='x', label='Positive')
ax2.scatter(negative['X1'], negative['X2'], s=50, marker='o', label='Negative')
ax2.legend()#添加圖列就是右上角的點(diǎn)說明
subplots代碼:
fig, ax = plt.subplots(figsize=(12,8),ncols=2,nrows=1)#該方法會(huì)返回畫圖對(duì)象和坐標(biāo)對(duì)象ax,figsize是設(shè)置子圖長(zhǎng)寬(1200,800)
ax[0].scatter(positive['X1'], positive['X2'], s=50, marker='x', label='Positive')
ax[0].scatter(negative['X1'], negative['X2'], s=50, marker='o', label='Negative')
ax[0].legend()#添加圖列就是右上角的點(diǎn)說明
ax[1].scatter(positive['X1'], positive['X2'], s=50, marker='x', label='Positive')
ax[1].scatter(negative['X1'], negative['X2'], s=50, marker='o', label='Negative')
ax[1].legend()#添加圖列就是右上角的點(diǎn)說明
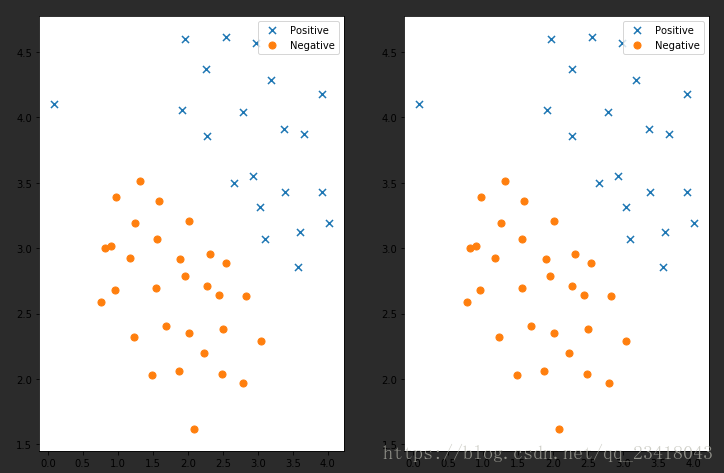
對(duì)比結(jié)果:
可以看出來兩者都可以實(shí)現(xiàn)畫子圖功能,只不過subplots幫我們把畫板規(guī)劃好了,返回一個(gè)坐標(biāo)數(shù)組對(duì)象,而subplot每次只能返回一個(gè)坐標(biāo)對(duì)象,subplots可以直接指定畫板的大小。
參考博客:Matplotlib的子圖subplot的使用
參考博客:subplots與figure函數(shù)參數(shù)解釋說明以及簡(jiǎn)單的使用腳本實(shí)例
到此這篇關(guān)于Matplotlib實(shí)現(xiàn)subplot和subplots簡(jiǎn)單對(duì)比的文章就介紹到這了,更多相關(guān)Matplotlib subplot和subplots內(nèi)容請(qǐng)搜索腳本之家以前的文章或繼續(xù)瀏覽下面的相關(guān)文章希望大家以后多多支持腳本之家!
您可能感興趣的文章:- matplotlib subplots 設(shè)置總圖的標(biāo)題方法
- matplotlib subplots 調(diào)整子圖間矩的實(shí)例
- Matplotlib 生成不同大小的subplots實(shí)例